Back
24 Feb 2020
S&P 500 Price Analysis: Index crashing, on track to worst daily decline since August 2019
- The S&P 500 is trading down sharply as it is on track to record its worst daily decline since August 2019.
- Bears are eying the 2020 low near the 3200 figure.
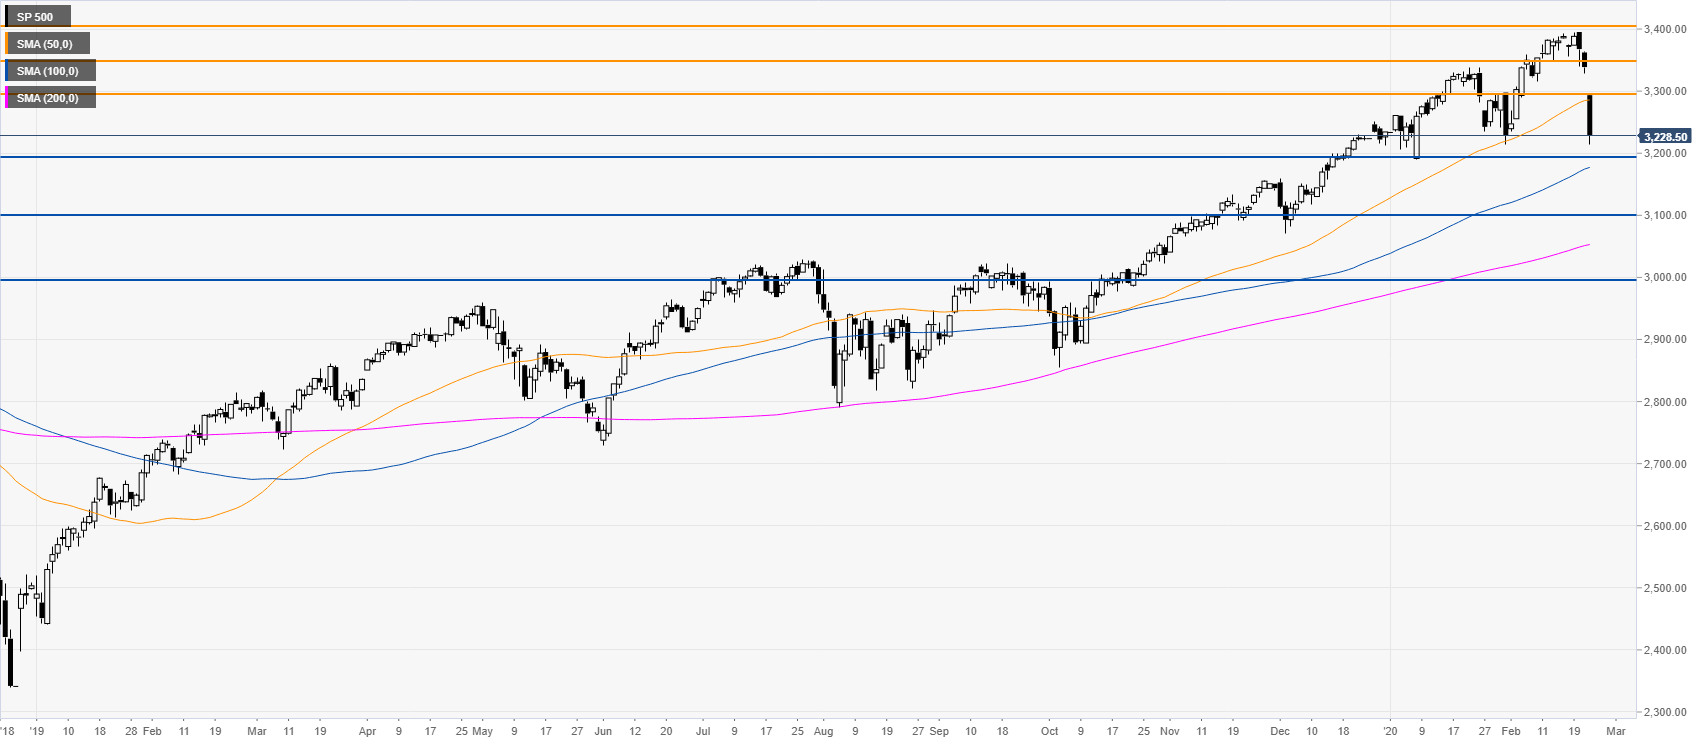
S&P 500 daily chart
The S&P 500 Index is trading is having a strong retracement down below the 50-day simple moving average (SMA). Bulls want to keep the uptrend going and defend the 2020 low and the 3200 big figure. However, failure to do so could see the bears extending the down move towards 3100 and the 3000 figure. On the flip side, a bullish recovery could find resistance near the 3300 and 3350 levels.
Additional key levels